
Welcome to Breaking the Blueprint— a blog series that dives into the unique business challenges and opportunities of underrepresented business owners and entrepreneurs. Learn how they’ve grown or scaled their businesses, explored entrepreneurial ventures within their companies, or created side hustles, and how their stories can inspire and inform your own success.
Welcome to Breaking the Blueprint— a blog series that dives into the unique business challenges and opportunities of underrepresented business owners and entrepreneurs. Learn how they’ve grown or scaled their businesses, explored entrepreneurial ventures within their companies, or created side hustles, and how their stories can inspire and inform your own success.

At first, AI marketing campaigns were pretty obvious — robotic and stiff. Then, slowly but surely, brands started getting it. Now I’m seeing AI-driven campaigns that feel alive; they’re innovative, tailored, and sometimes so smart, you’d swear they were made by humans.

If you’re like most marketers, you’ve tried out a generative AI tool. You’ve played around with ChatGPT to generate headlines. Yet, these fragmented use cases don’t capture the full power of deploying AI strategically. In five years, many companies will be creating AI marketing campaigns.

I’ve submitted hundreds of electronic resumes throughout my career. These digital job applications hold so much weight in the job search process. It’s always nerve-wracking to make sure I’m doing everything right.
I’ve submitted hundreds of electronic resumes throughout my career. These digital job applications hold so much weight in the job search process. It’s always nerve-wracking to make sure I’m doing everything right.

The instrumental to Missy Elliott’s “Pass That Dutch” is blaring through your speakers while Lindsay Lohan is on your screen walking through the halls of North Shore High School. Did you just transport back to the early 2000s?
The instrumental to Missy Elliott’s “Pass That Dutch” is blaring through your speakers while Lindsay Lohan is on your screen walking through the halls of North Shore High School. Did you just transport back to the early 2000s?
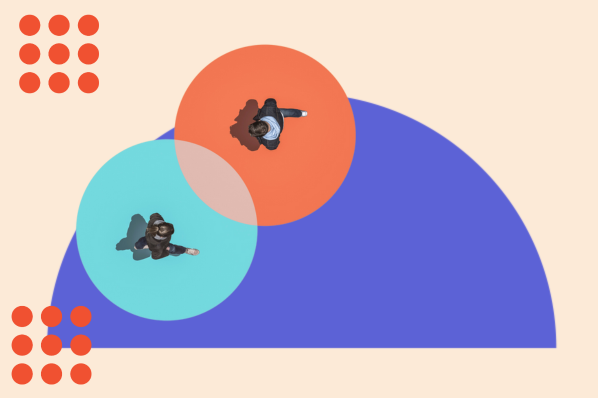
The theory that we can only hold a finite number of stable social relationships has long been debated.
The theory that we can only hold a finite number of stable social relationships has long been debated.