
Sometimes, it’s really tempting to cut corners.
It’s the end of the month. You’ve got an aggressive goal to hit. Will anyone really be that mad if you buy that list or make a couple cold calls? You promise — it’s just this once.
But we all know how easy it is for that excuse to fall by the wayside.

Over the past several years, LinkedIn quickly evolved from a cocktail party for recruiters and job seekers to something much more substantial: an epicenter for content — particularly branded content.
LinkedIn’s evolution began in May 2012 with the acquisition of SlideShare, and it continued with the purchase of news reader app Pulse.

Kurt Vonnegut was not a copywriter … but he could have been.
That’s what dawned on me after reading “How to Write with Style,” an essay Vonnegut published in the 1985 anthology, How to Use the Power of the Printed Word. In it he outlines the eight rules for great writing — rules that can be applied to any type of writing, including copywriting.

This post originally appeared on Agency Post. To read more content like this, subscribe to Agency Post.
We have an insatiable thirst for the new.
In business, we want new products, new campaigns, and new ways of reaching consumers.

This post originally appeared on HubSpot’s Sales Blog. To read more content like this, subscribe to Sales.
Stop me if you’ve heard this one before.
“Mabel, Mabel, sweet and able, get your elbows off the table!”

When we talk about data analytics and measuring ROI, there are several standards that we use to categorize success—website visits, number of new contacts and revenue gains or losses. These are all helpful metrics and should be taken into consideration in any marketing report. However, there are loads of different ways to measure success in digital marketing, and success looks different from industry to industry—particularly in the healthcare industry.

Gone are the days where “I’m not creative enough” or “I don’t have any design experience” serve as sound excuses for avoiding design entirely. Thanks to new technology, it’s possible for pretty much anyone to create optimized graphics to support their campaigns and lead generation efforts.
With photos in tweets averaging a 35% boost in retweets and captions under graphics being viewed 300X more than body copy on average, compelling graphics have become an increasingly important part of the marketing plan.
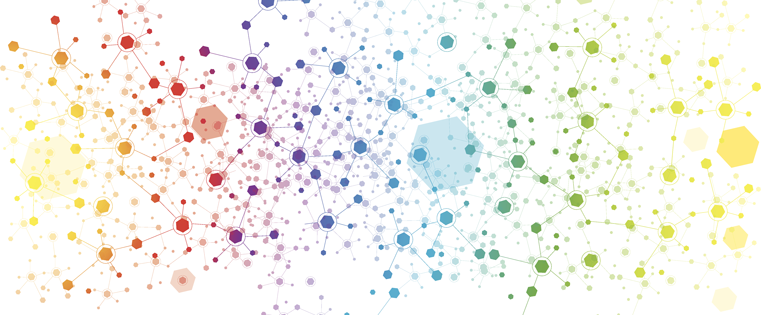
Data can be very powerful. If you can actually understand what it’s telling you, that is.
It’s not easy to get clear takeaways by looking at a slew of numbers and stats. You’ve got to have the data presented in a logical, easy-to-understand way.
Enter data visualization. The human brain processes visual information better than it processes text — so using charts, graphs, and design elements, data visualization can help you explain trends and stats much more easily.

How many times have you uttered the phrase, “I wish I’d thought of that”?
It often seems that certain people have the power to formulate creative, inspired ideas, but the truth is, you and I are just as capable as the next person.
Sure, unleashing your creativity isn’t always easy — especially when you’re brainstorming in a group setting.